Crude Tanker Freight: Welcome to the Era of Extreme Volatility
The energy market is fully disrupted, shipping is going through one of the most severe crises in its history.
Since the start of the conflict and the near-closure of the Strait of Hormuz, crude tankers have been hit harder than any other segment. Trade routes have been redrawn, ton-miles has exploded, freight rates reached levels nobody would have called realistic a year ago.
Moving a barrel of crude has become a complex and, in some cases, risky operation. With Brent now around $115/bbl, there is little sign of relief, and the deals that do get done are concluded at record levels.
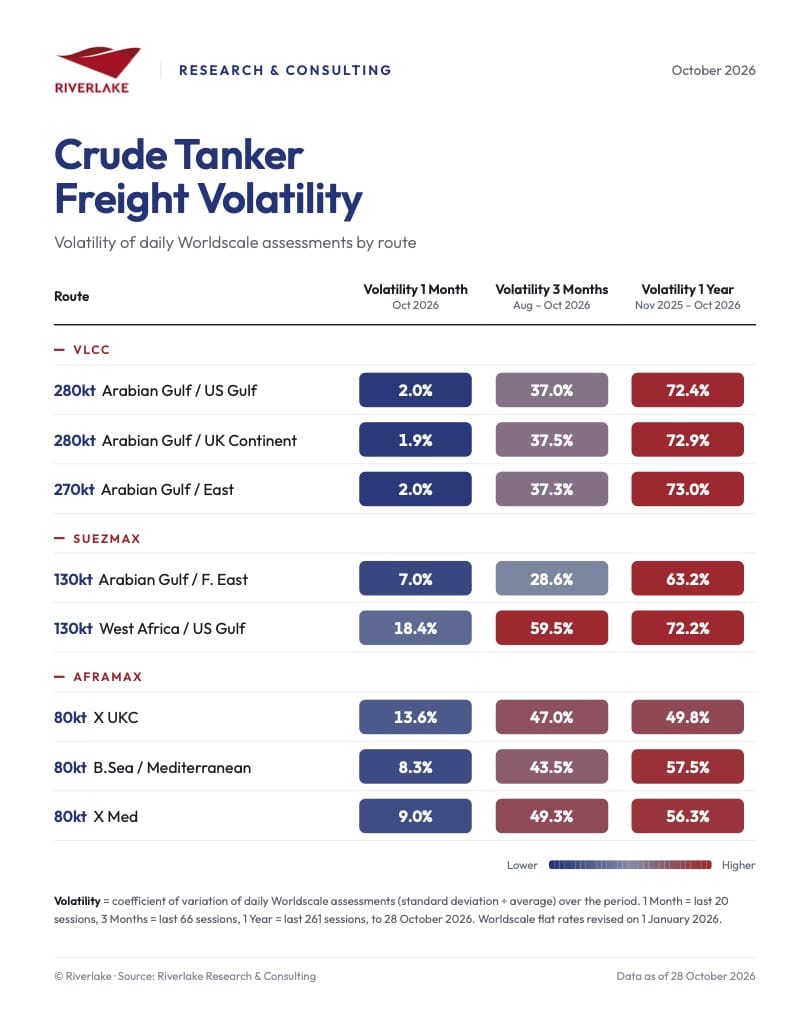
Our volatility table across the routes we track tells the story:
🔹 VLCC: 270kt Arabian Gulf / East went from WS 51 in early January to WS 1221 today, ×24 in under ten months. Volatility 1 Year: 73%. Yet Volatility 1 Month is just 2%: the market has not calmed down, it has stalled on a record plateau.
🔹 Suezmax: the most unstable segment in the short term. West Africa / US Gulf shows the highest Volatility 1 Month of the table at 18.4%, and close to 60% over 3 months, with single-session moves of up to +58% and −26%.
🔹 Aframax: no route has been spared. Volatility 3 Months reaches 43% to 49%, and Volatility 1 Year 50% to 58% across all the routes we track, with daily swings of more than 25% on several of them.
These numbers need some context.
→ Assessments vs. reality: on some routes, record assessments are partly notional. A route can be assessed at WS 1,000+ with very few, or even no, fixtures actually concluded. The level reflects where the market would trade, not always where it has traded.
→ Risk is priced in, but not everywhere: on Arabian Gulf loadings, assessments include war-risk costs and the premium owners demand to trade in the area. Routes away from the conflict zone, such as cross-Med, carry no such premium. Comparing rates across regions therefore means comparing very different risk profiles.
What does it mean?
→ Charterers: securing tonnage has become a challenge in itself. Vessel availability is tight and charterers have found themselves paying unprecedented amounts. In September, the benchmark Middle East Gulf / China VLCC route (TD3C) was assessed above $1 million per day for the first time in history, around three times the peaks of 2019–2020. In October, Gulf of Oman spot fixtures were concluded above $1 million per day on a TCE basis.
→ Owners: earnings are at historic highs, but they come at a cost. Trading in or near the Gulf exposes crews and vessels to very real risks, with attacks on merchant ships still being reported.
→ Everyone: risk management, flexibility and real-time market intelligence have never mattered more.
The question is no longer “where are rates?” but “where will they be tomorrow?”
Questions on the numbers? Let’s talk: research@riverlakegroup.com
By David Gailloud, freight analyst from our Research Desk.